In this blog post we will discuss debugging and provide you with some simple tips for debugging your code.
In VBA when we write code, it often doesn’t work how we expect it to or we think it is working fine but need to be sure before handing it over to a client. For this reason we use debugging tools to enable us analyse our code whilst it is running.
Note: When writing code it is completely normal for it not to work as expected. Very few programs work 100% error free (if any at all) and our job as coders is to eliminate major errors and bullet-proof our code by making sure that any unforeseen errors are handled in some way and not just left to confuse the end user.
In order to understand debugging, we need to identify the difference between a handled error and an unhandled error. We can never fully anticipate all errors that will occur so we need to have a kind of safety mechanism to ensure that if errors do occur, they are handled accordingly. When we write code that achieves this we are handling errors.
In this first example we have an error because we are trying to divide 5 by 0. This is a common error that occurs in VBA. Test the code and see what happens. An ugly dialog box appears and gives us some information which may be useful to a developer but not to an end user.
Sub unhandledError()
    Dim i As Integer
    i = 5 / 0
End Sub
In the second example we have included an error handler. The snippet of code that says On Error GoTo error_handler tells the Access that if an error is encountered the code should immediately jump to the section entitled error_handler where we have some lines of code that bring up a much more informative and instructional dialog box that we have created.
Note: If you still get an ugly useless dialog box then you will need to set Error Handling to Break On All Errors. We show you how to do that below.
Sub handledError()
    On Error GoTo Error_handler
    Dim i As Integer
    i = 5 / 0
Exit_Sub:
    Exit Sub
Error_handler:
    MsgBox "There has been an error. Please try running the code again or reloading the form."
    Resume Exit_Sub
End Sub
Error handling such as this is typical in VBA code and is the mark of a bullet-proofed application.
Breakpoints
A breakpoint is a marker one places on the code and at which point execution breaks and stops to allow the debugger to operate. There are many cases when such an activity is really useful.
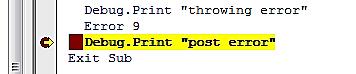
Say you have a long calculation and you know there’s an error in it but don’t know where. By clicking on the column where the red dot is displayed below, the row will become highlighted indicating a breakpoint. Then you run the code and once the breakpoint is reached the code is paused and the VBA editor has gone into debug mode.
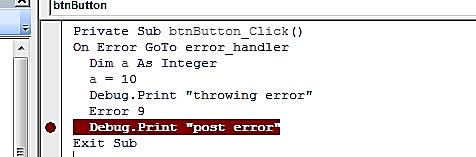
Debug mode in the VBA editor isn’t much different to normal mode except that the debug control bar’s controls are enabled and you can see a yellow line indicating the line of code waiting to be executed. In order to resume executing code from this point, press F5. If you would like to step through the code one line at a time you can press F8.
Debug Control Bar
The debug toolbar is your next companion in battle. When this bar is active it allows you to step through your program and examine it in great detail.
![]()
| |
The Play button tells the executive to continue running from the line that is currently highlighted. |
| |
If the debugger isn’t yet engaged, you can pause the execution and enter debug mode immediately. |
| |
Stop forces an immediate cessation of execution and the call stack to be cleared. |
| |
The hand toggles a breakpoint on current line. |
| |
On a line which contains a user-defined function the Step-In follows execution into the next function or procedure. |
| |
Or rather than stepping into the function on can jump over the function, allowing it to execute as needed, and take up debugging once the sub-method has finished. |
| |
Step out tells the debugger to continue executing the rest of the current procedure until it completes. |
| |
Displays the Locals Window which displays all local variables in use and their values. |
| |
Toggles the visibility of the immediate window. |
| |
Toggles the Watches Dialog box. This box is navigable allowing you to drill down into all local variables currently in use and inspect them in minute detail. |
| |
Quick Watch creates a quick watch item using the currently selected variable. |
| |
Call Stack displays a list of functions and procedures that have lead up to this point and will be returned to. |
Error Trapping
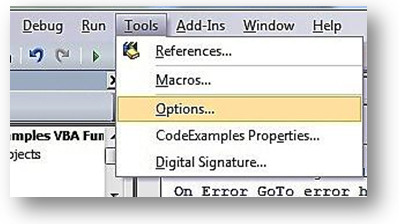
Here we show you how to choose different types of error handling in the database. We do this by selecting Options from the Tools tab:
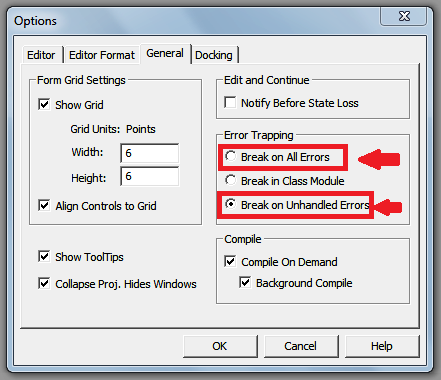
Select the General tab of the dialog box.
Tick “Break On Unhandled Errors” or “Break On All Errors” in the “Error Trapping” Option box depending on your requirement.
Try to remember this:
When you are writing code, you want to see all errors UNHANDLED. You want specifics, want to be able to jump to the code at the right point and make adjustments. When you are letting “others” use your database, you need to make sure you have handlers for all your errors and Break On Unhandled Errors is set or all hell could break loose.
As noted above, the key point to remember about debugging is that no code is error free. There is no way to anticipate all errors that may occur so it is important to ensure that they are handled properly.
Related Posts
Immediate Window DebuggingVisual Basic EditorBasic Tools for Writing Code Visual Basic Editor
Compilation Explained Visual Basic Editor
Opening The VBA Editor Visual Basic Editor
The VBA Editor Explained Visual Basic Editor
Visual Basic Editor Options Visual Basic Editor
Have you ever done a tutorial on the error “return without gosub”? I am constantly getting it and it is driving me crazy